Delivery Performance Statistics (DPS)
DPS is an application which can be used to view statistics about confirmed and requested delivery date calculations for customers and suppliers. The application shows if deliveries has been done early, on time or late.
To start the application, write DPS in the program field and press ENTER.

Column descriptions
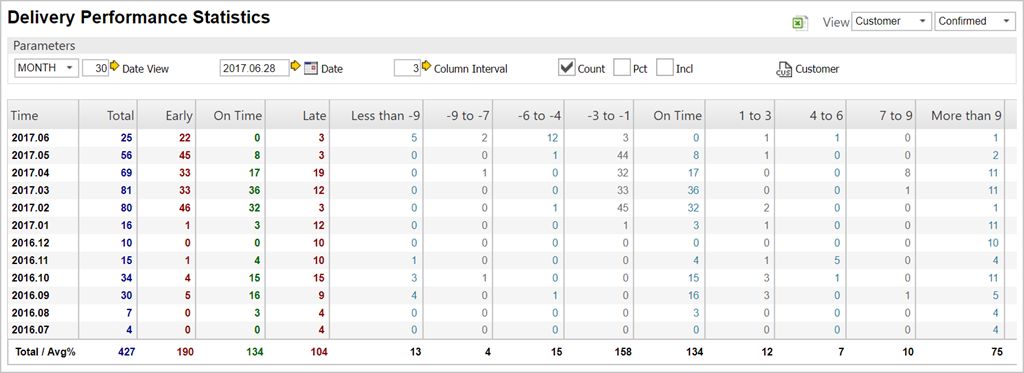
Time - This column shows the date intervals.
Total - The blue column shows the total amount of deliveries in the defined interval.
Early - The red column contains information regarding all early deliveries.
On time - The green column lists all deliveries that have been on time.
Late - The last static column, which is also red, shows all the deliveries that has exceeded their delivery date and is listed as late.
The rest of the columns are dynamic and shows detailed information on deliveries by the user-defined parameters set in the parameters-box.
Field descriptions
Column Interval - The Column Interval field indicates the interval used by the detail columns below, with a default set to 3 days.
Count checkbox - This checkbox gives the user the opportunity to show, or hide, the totals.
Pct Checkbox - This checkbox enables the percentage of delivery differences to be shown.
Incl Checkbox - This option ebables the user to filter non-confirmed and non-requested shipping documents.
The algorithm for calculating the required and confirmed date is stored in a batch program which runs every night in RamBase. The calculated values are stored in the CSA and SSA document fields DPCONF and DPREQ. When the batch program is not able to perform the calculation, these fields gets the value 0.
The first column in the application is showing the date intervals.
The blue column is the total number of deliveries.
The green column is showing statistics about deliveries done on time.
The red columns contains information about early and late deliveries.
The remaining columns in the application are showing detailed information about deliveries, based on a given day interval.
View options
First the user needs to select if the application shows statistics about customers or suppliers. This choice is found on the upper right corner drop-down list. Default view is set to customer.
The user can also choose which view should be started by simply writing DPS / CUS or DPS / SUP in the application command line field. To select between confirmed and requested, use the second drop-down list in the upper right corner of the application.
Parameters
The application is by default showing statistics on monthly basis, starting on todays date. The default column interval is set to 3 days. All parameter choices are found on the parameters task bar.
In the first field select the date view you want the statistics to be presented in.
If you choose the DAY INT (day interval) default interval is set to 30 days. This can changed by the user.
StartDate is by default set to today's date, but can be changed by the user in the date field. Or simply click the calendar icon to choose the Startdate from the calendar. Date format is YYYY.MM.DD.
The column interval field is used by the detail columns. The detail columns contains information about deliveries done early, on time and late on a given day interval. Default is set to 3 days, but this can be changed based on the users' needs.
The Count checkbox is used for showing and hiding totals.
The Pct checkbox is used for showing and hiding percentages.
The Incl checkbox is used to include non-confirmed and non-requested shipping documents. By default the application is including early, on-time and late shipments.
An early shipment is a document with DPCONF or DPREC value less than 0. A late shipment is a document with DPCONF or DPREC greater than 0.
An on-time document is a document with DPCONF or DPREQ equal to 0. In addition, CONF or REQ date is required.
When checking Incl, non-confirmed and non-requested documents are included. A non-document has the value 0 in DPCONF or DPREQ and does not have a CONF or REQ date.
Checking Incl has impact on calculations in the total and percentages columns. The non-confirmed and non-requested totals and percentages are shown in own columns.
Blank, null and values starting with “N/A” are not included in the report.
When reconfirming an order where one chooses CausedBy=Supplier/Customer, RamBase will skip this order acknowledgement (SOA/COA), and look at the first registered order acknowledgement. This is done to ensure the correct statistics regarding too early/too late delivered. If one agrees with the new confirmed date one should enter CausedBy = US and RamBase will use the new confirmed date, since this was agreed on.
Customer and Supplier filtering
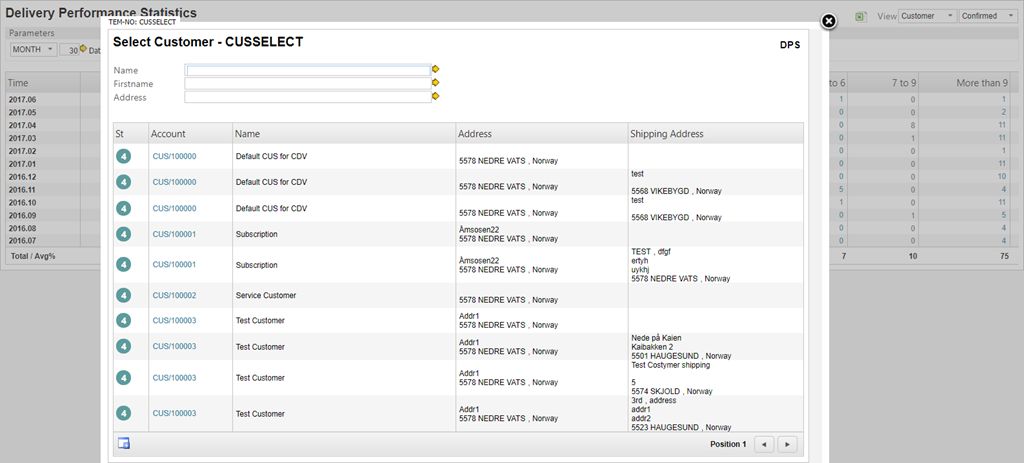
By default, the application is showing statistics for all customer or suppliers. To filter this information, press the Customer or Supplier icon on the parameter task bar.
This brings up the Customer or Supplier popup window where the user can filter the statistics shown in the application.

To remove the Customer and Supplier filters press the Remove Account Restriction icon.