Workspace for production
An instant view of the factory
The PRODUCTION workspace gives the management a ‘status’ view of the factory and the current activities. The tool gives information about key figures such as produced value, delivery performance, resource activity, delayed production and value of the delayed production, capacity utilization, measurement tools, reports ++ . So the tool is applicable both for the CEO and the production management. Needed permission to view the workspace is ViewProductionWorkspace.
Contents
 | The buttons in this section gives access to their corresponding applications: |
Prodplan - The PRODPLAN application for production planning. | |
Resources - The resource (RES) menu. | |
Product Work Balances - PWBAL application for work balances reports. | |
Delivery Performance - DPS, delivery performance statistics. |
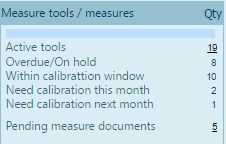 | Measurement tools (MET) can be added to the system as a part of the production documentation module. Keep control of your instruments status and calibration dates in RamBase. Click on the number of ‘Active tools’ to access the MET menu and use filters there to view e.g. METs needing calibration. |
Active Tools - MET with status (ST) =8 are active instruments. Inspect on number goes to the MET menu.
Overdue/On hold - Number of MET with Nextservice date that is before ‘today’
Within calibration window - Number of MET with Nextservice date that is before ‘today’ + number of days that is specified in the company setting ‘ServiceWarningDays’.
Need calibration this month - Number of MET with Nextservice between and including ‘today’ and the end of the current month.
Need calibration next month - Number of MET with Nextservice within next month.
Pending measure documents - Number of measurement documents (MSR) that are ready to be approved.
The ‘Key Figures’ section shows values for delivered (completed) productions, delivery performance, cost and time for planned production (forecast) and some figures for todays activity.
History
Delivered production

This is produced value for completed productions (SSA with DocType = PRODUCTION) with date matching the actual periods in the table. The calculated value is then the sum of the NetAmount for these actual SSAs. The sums are not calculated ‘on line’ but are stored values that are recalculated by a night batch job or by the recalculate icons at the Key Figures header.
The calculation routine checks each BOM (KIT) for sub KITs and reduces each SSAs value with any found cost from the subs that are produced internally to ensure that the produced value is not ‘doubled’ and that the values are correct within the actual periods. Purchased articles with Class = K* are calculated as any other ingoing part/material (not production).
Delivery performance %
Delivery performance (DPS) for customers in percentage, sum of early + on time.
Forecast
Resource plan h/%

These values are calculated from resources (RES) that are not group resources (only members and single resources) and that are classified as active (ST less than 9).
Hours/ | = planned hours = sum of all Used (DayUsed) hours for dates within the rest of the actual period. Found in the ‘Usage’ folder at each RES. |
/utilization rate = sum of DayUsed divided by sum of DayCapacity * 100 (%) for the resources and rest of the actual period.
Production cost plan

These values are showing the sum of planned cost for planned and running productions. PWO that are confirmed and active and that have status >1 and < 9. Sum of the PWOs NetAmount and as for delivered production this is also reducing the value for each PWO with value for used sub KITs.
ProdEnd (calculated production end date) decides in which period the value is included.
The Delivered production and the Production cost plan values can also be shown as graphs by clicking at the graph icon at the section header.
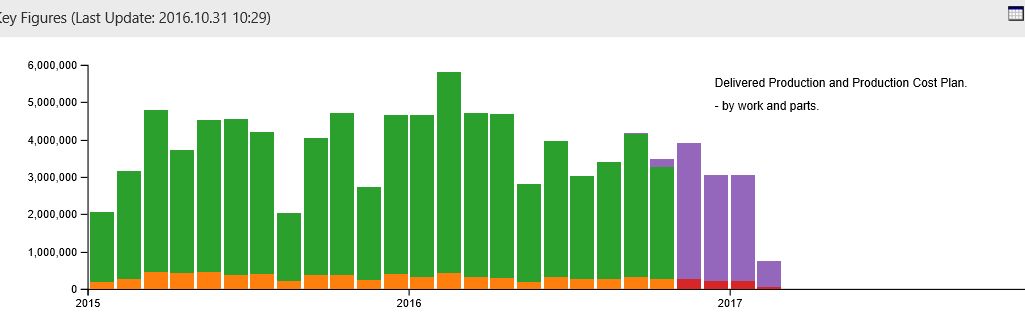
Green material cost and added material cost for production history (completed production).
Orange operation cost for production history (completed production).
Blue planned material cost and added material cost for the production plan. Running and planned production.
Red operation cost for the production plan.
Today
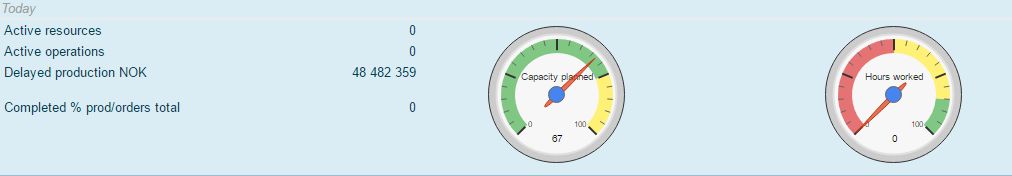
These two speedometers shall indicate how the available resources are utilized today and indicate how the reality meets the planned utilization.
Active resources Number of resources with running or paused jobs
Active operations Number of running or paused jobs
Delayed production (cur) The value of production orders where at least one of the operations is delayed with 1 day or more compared to planned for the operation.
Completed % prod/
orders total For running / released production orders, PWO with status (ST) > 5 and < 9.
Accumulated accrued time / accumulated planned time * 100.
Result > 100 = overused time.
Speedometer 1 | Planned utilization for all resources today. Utilization = sum DayUsed / sum DayCapasity * 100 (%). |
Speedometer 2 | Logged time today compared to planned time today. Sum logged time / sum DayUsed * 100 % |
The boxes below the speedometers
These boxes will show some numbers and figures, some of them with inspect possibility, for number of production orders, production orders waiting to be released for production, delayed productions, production value of delays, quality reports.
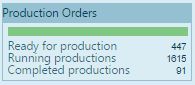 | Ready for production: PWO with ST = 4, PRODSTART <= today Running productions: PWO, ST=5 Completed productions: PWO, ST=8 |
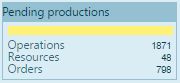 | Operations: Planned operations waiting for preceding operation to be completed. Resources: Resources with waiting operations. Production orders: Work orders (PWOs) with waiting operations. |
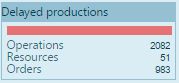 | Operations: Active or waiting operations that are delayed compared to planned start/complete date. Resources : Resources with delayed operations. Production orders: Work orders (PWOs) with delayed operations. |
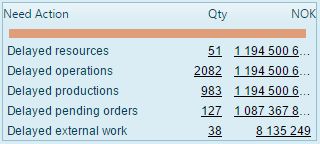
The first three lines in the list are representing the same numbers as in the Delayed productions box above but here including the value of the delayed production orders behind these numbers.
Inspect on the numbers at line 1 and 2 goes to PRODPLAN and folder Delayed operations.
Inspect on the number at line 3 goes to PRODPLAN and folder Delayed productions.
Delayed pending orders:
This is the number of customer order items or production orders that are linked to Pending, meaning that a production work order (PWO) needs to be created for this.
Inspect on the number at line 4 goes to PRODPLAN and folder Pending by Order.
Delayed external work:
Active or waiting external operations that are delayed compared to planned start/complete date.
Inspect on the number at line 5 goes to PRODPLAN and folder External Operations.
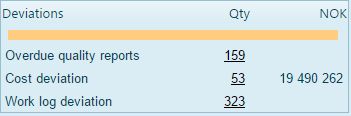
Overdue quality reports This is the number of QAR documents that are not closed (ST < 9)
and where DUEDATE < today. Inspect to the QAR menu.
Cost deviation | Number of operations with cost deviation alert. Inspect to report REP/102680 |
Time deviation | Number of operations with work log alert, that is operations that have been completed and the difference between logged work and planned work is higher than the company setting. Inspect to report REP/102681 |
REPORTS:
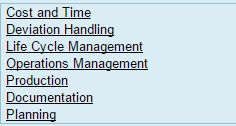
The reports section shows links to group of reports related to sub modules that are part of the production module.