Create a new report
To create a new report, the users must have access to the editor icon in the FRP application main window. To enter the editor and see the definitions of a report, one must click on the editor icon.
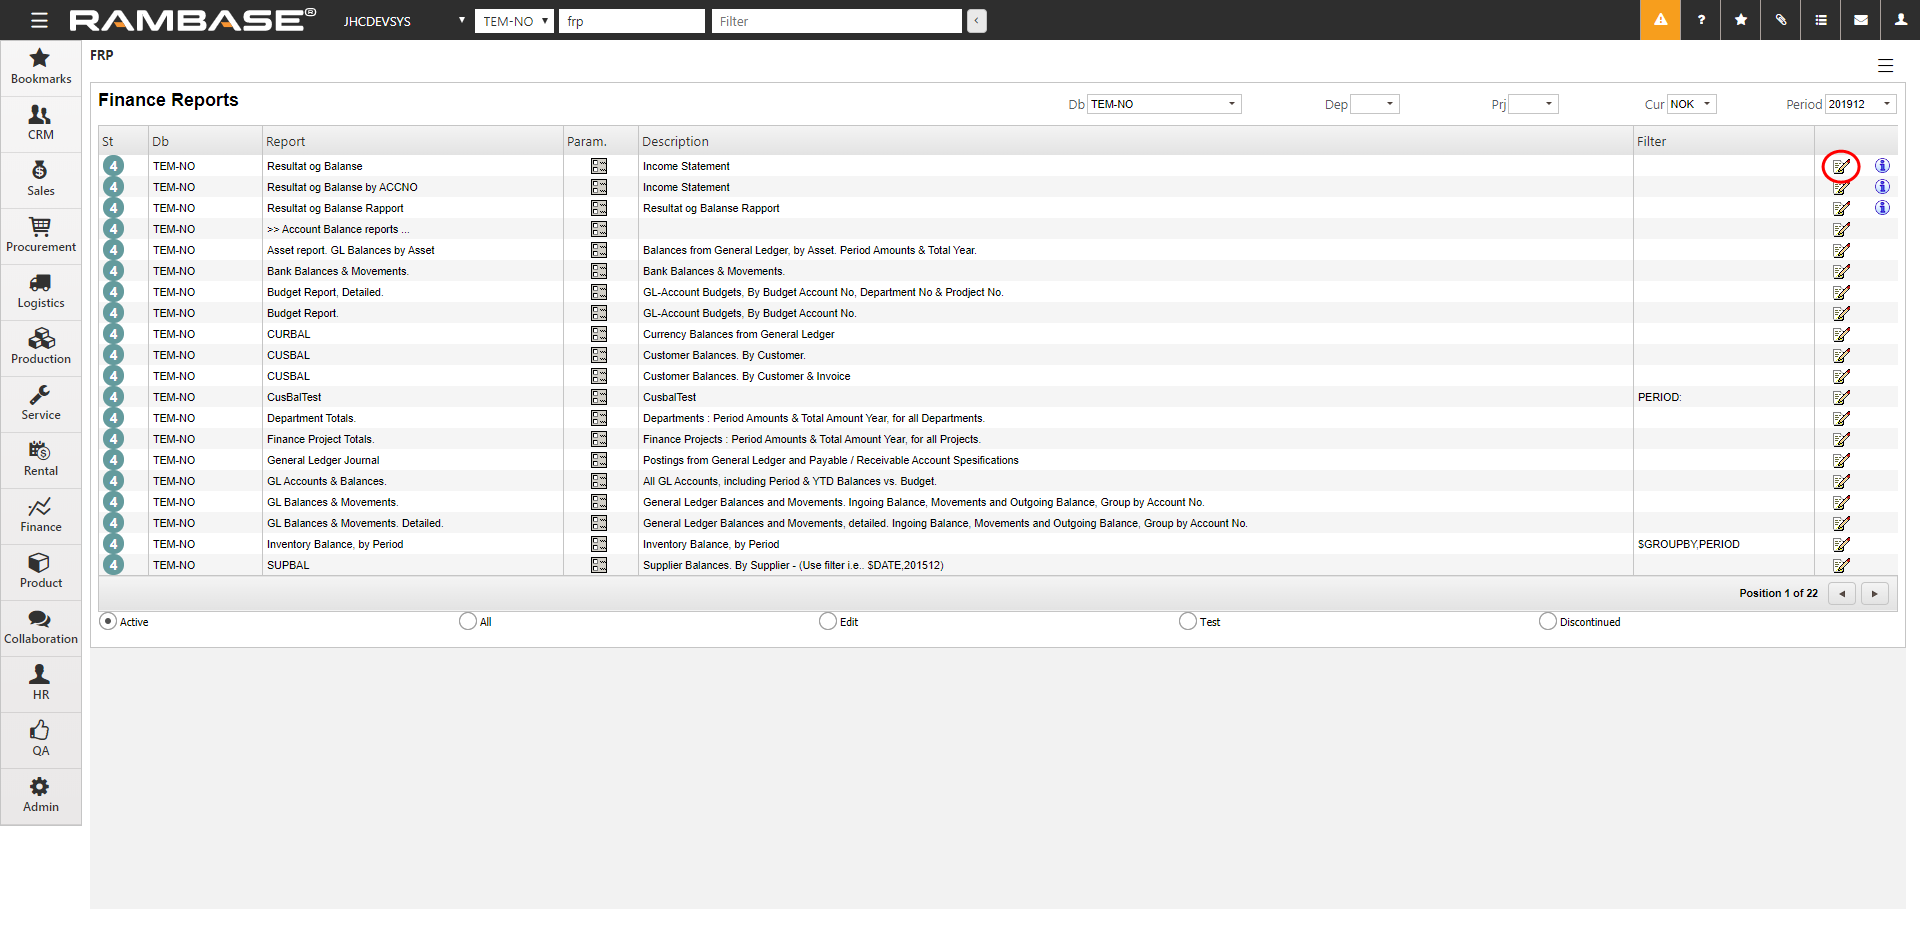
When entering the Finance Report Editor, the report status will usually be 4. To edit the report, press F12 to open the action menu and choose Make Edit Version (St=1) option. Notice that a report in status 4 usually is operative and should not be an object of editing. The recommended way of editing a report is:
Enter the editor in the report you want to edit.
Press F12 to open the action menu and choose the Copy to new Report Definition option.
The new report can then be edited while the original report is still operative. If you want to use the new report instead, the original report can be discontinued when the new report is done.
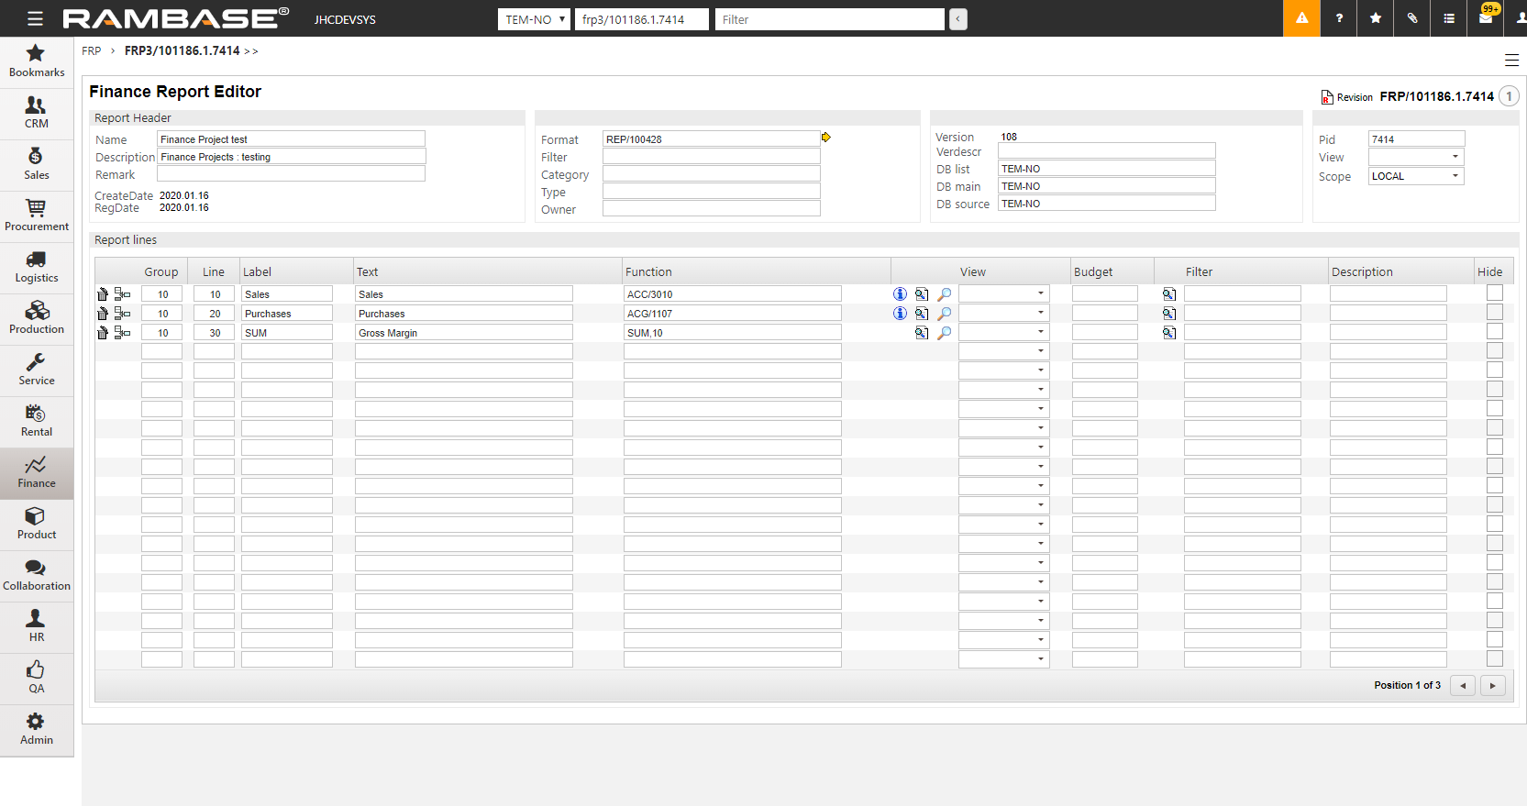
The new report will be made in status 1, which means that it is editable right away. The first thing one should do is to alter the Name and Description fields of the report. These fields are necessary to identify the report in the FRP application main window. To make a completely new report, click the trash can icons in the Report lines section to clean the report. If it is a question about minor alterations, the report lines should probably stay as they are.
Also notice the use of the DB list, DB main and DB source fields:
DB list - The field lists the companies for which the report is available. That is, the report will show up in FRP for all companies listed in the field.
DB main - The field indicates the "mother" database of the report. The report uses the default settings from this database when running the report. If for instance a report is drawn from companies with different default currencies, the company entered in the DB main field determines what currency which would be used in the report.
DB source - The field lists the companies where the report should draw its data from. The report summarizes data from all companies in the DB source field.
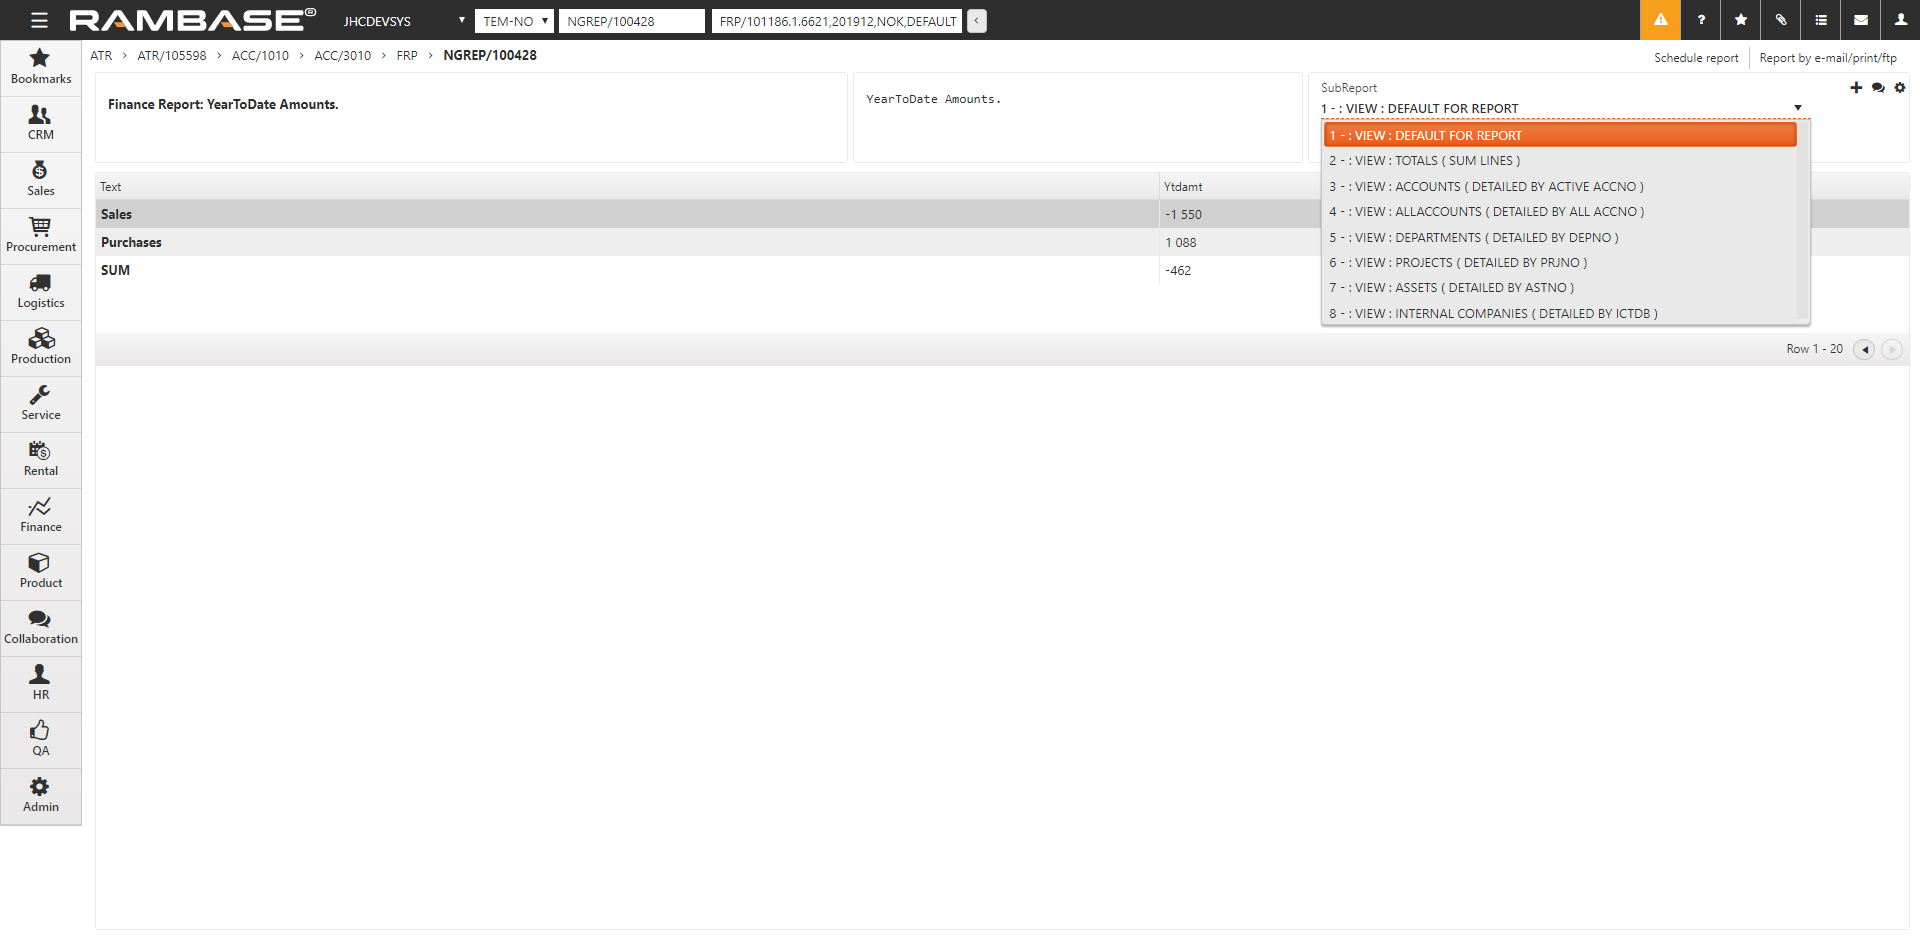
The View field in the Report Header area determines the level of details in the report. Possible values for the fields are:
Report default
Grand Totals - Balances are summarized. Report is only showing lines labeled as SUM.
Detailed - By Active Accounts - All underlying accounts in the account groups, which have had postings made to them during the period for which the report is running, are shown in the report, displaying the balance for each account.
Detailed - By All Accounts - All underlying accounts in the account groups are shown in the report, displaying the balance for each account.
Detailed - By Departments - Balances in the report are grouped by departments.
Detailed - By Projects - Balances in the report are grouped by projects.
Detailed - By Assets - Balances in the report are grouped by assets.
Detailed - By IctDb - Balances in the report are grouped by intercompany databases.
Report lines
The report lines area is explained column by column, starting from the left.
The trash can icon deletes the report line.
The insert icon inserts a report line above the current line. The new line inherits the group/line definition from the current line.
The Group/Line definition have several purposes.
It determines the order of the data to be viewed. Group 10 is placed above group 20, and line 10 is placed above line 20.
It can be used to arrange the data in logical groups, which makes the editor view more readable for any users trying to edit the report later.
The group definition is also used by the SUM function. All lines in a single group can be summarized by the SUM function.
The Label definition is particularly useful when some of the report lines are used as variables. The line 10/10 labeled Sales, can be referred to as the variable Sales shown in the example above.
The Text column contains no amounts or calculations, only information. This is displayed as line text in the report.
The Function definition is the key component in report building. Possible values in this column is:
ACC/xxxx - A reference to a certain ledger account. If the report line is not hidden, the amount posted of the ledger account is shown in the report.
ACG/xxxx - A reference to a certain account group. If the report line is not hidden, the amount posted to the ledger accounts in the account group is shown in the report.
TEXT - The report line contains no amounts or calculations. Only the text in the Text column is shown in the report.
SUM - A function that summarizes the report lines with the same group definition. SUM,10 summarizes the report lines in group 10. SUM,10,20 summarizes the report lines in group 10 and 20. SUM,10,-30 summarizes the report lines in the groups 10 to 30.
CALC - A function that make calculations from variables defined (labeled) in the report. In the example above, the report line 10/30 sums sales, purchases and views the gross margin as an amount. The CALC function can be used to view the gross margin in percent as well.
The sales amount is held in the report line 10/10. The line is labeled Sales. In accountancy, sales are presented as negative numbers.
The purchase amount is held in the report line 10/20. The line is labeled Purchases. In accountancy, purchases are cost and presented as positive numbers.
The labels of the ACC, ACG and SUM lines can be used as variables in a calculation. However, the label of a calculated line can not be used as a variable in another calculation.
The information icon gives the user the possibility to inspect the ACC or ACG set up in the function field.
The paper-with-a-magnifying-glass icon is where an ACC may be chosen to the function field.
The magnifying glass icon is where an ACG may be chosen to the function field.
The View field in the Report lines area determines the level of details on the selected report line
Possible values for the fields are:
Report default
Shown As Defined - If view in the header is set to by all/active accounts and item view for one report line is set to show as Defined, the account group will not be expanded.
Grand Totals - Balances are summarized. Report is only showing line labeled as SUM.
Detailed - By Active Accounts - All underlying accounts in the account group, which have had postings made to it during the period for with the report is running, are shown in the report, displaying the balance for each account.
Detailed - By All Accounts - All underlying accounts in the account group are shown in the report, displaying the balance for each account.
Detailed - By Departments - Balances in the report line are grouped by departments.
Detailed - By Projects - Balances in the report line are grouped by project.
Detailed - By Assets - Balances in the report line are grouped by assets.
Detailed - By IctDb - Balances in the report line are grouped by intercompany databases.
The Budget column is used to overrule from where the budget numbers will be collected. Different accounts in one account group may be linked to different budget accounts (BAC). As a default, these BACs will be summarized and presented in the report. If one wants just one specific BAC to be presented in the report, this BAC should be added in the Budget column.
The magnifying glass icon next to the Budget field is where an BAC may be chosen to the budget field.
The Filter column is used to filter the data shown in a single report line. Filters that are applicable in the ATR application can be used as a filter in FRP.
The Description column is used for internal messages only. There is no functionality to this column.
The Hide box is used to define the report line as a variable or not. If the Hide box is checked, the line will not show up in the report, but the label can still be used as a variable in a function (SUM or CALC). Notice that a line-label can be used as a variable even if hidden is not selected, but when it is selected the only function of the line is to be a variable.
Proper use of summarizing in FRP
To ease the building of reports, and to minimize the length of CALC formulas, it is important to stress the proper use of summarizing in FRP. Ledger postings can be summarized by putting them in an Account Group (ACG). Using ACG references instead of ACC references is preferred to sum accounts at the ledger level. The ACGs can then be summarized in the FRP editor by well-considered use of group/line definitions and the SUM function. It is not possible to use the CALC function to summarize, if a calculated line is applicable in another calculation.
Running a report in status 1 or 2
When building a report, there is often a need to run the report during building. Running a report in edit mode is done the same way as running an active report in status 4. Leave the FRP editor, Click the Edit radio button and select the report in status 1 from the FRP main window and press ENTER. Click the editor icon to enter the FRP editor again. If you want someone else to test the report, it must be forwarded to status 2 (test mode). Enter a text in the Verdescr field, then press F12 to open the action menu and choose the Make Test Version (ST=2) option to put the report in status 2. Reports in status 2 can be found by clicking the Test radio button.
Creating ACG from an FRP report
In reports created by the F12 option Create local finance report from template or other FRP reports you made yourself, make sure each line in the report has an underlaying Account Group (ACG). If the lines do not have an underlaying ACG, information about this will show on each line as Account group missing when running the report. Missing account groups can be created by F12 option Create Account Groups from Report Definition in the report definition. Pressing ENTER on a line in the report will take you to the ACG where you may connect one or several GL accounts to one ACG.
Choosing report format
When the report lines are built, click the yellow arrow icon in the Format field in the editor heading to bring up the Report Format window.
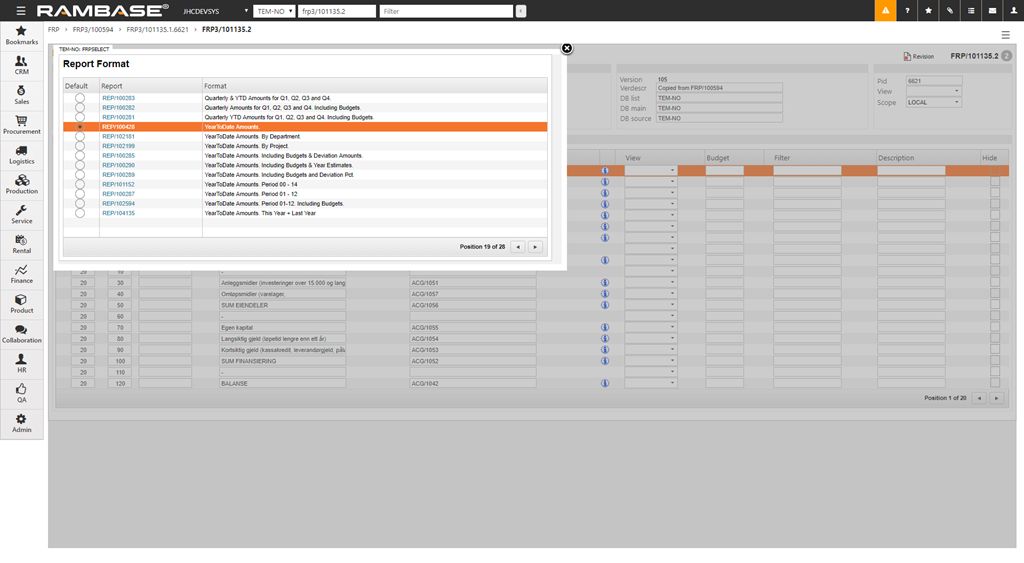
Chose the desired default report format from the list and close the window. As previously described, this can be overridden when running the report. The report is done.
Sub reports
In some reports it is possible to select different sub reports to change what is displayed in the report. Choose between different sub reports in the SubReport field in the report.
Create local finance report from template
When a new database is created, it will get some standard financial reports. These are presented in the FRP archive. It is also possible to import other financial reports from a template report. This is done by the F12 option Create local finance report from template. You will see an overview of available reports. Import by highlighting the desired one and press ENTER. Depending on the company’s COUNTRY, different reports will be shown in the overview.