QA Reports
The Quality Assurance Report archive (QAR) contains reports on quality deviations and actions taken to improve the overall productivity and service quality. The archive is managed by the QAR program.
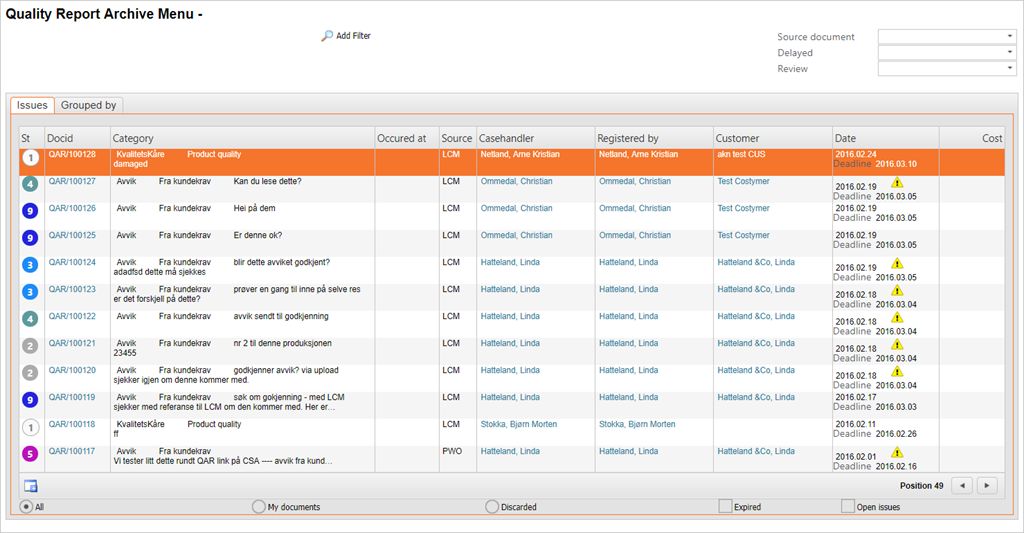
To inspect the archive content, write QAR in the program field and press ENTER.
To inspect a single report, click the DocId link or highlight the report entry and press ENTER.
Searching the QAR archive
The list of quality reports may be restricted by filters and by their report status. It is also possible to list predefined sets by clicking the radio buttons below the menu listing.
Simple search strings - The QAR program searches the DocId field. If you add a number to the program name (for example QAR 101137) the program searches for reports with a similar document id.
Predefined subsets - Select the predefined subsets by clicking the radio buttons below the list. In addition to the All documents subset, and the My documents subset, you may list reports for which the deadline has expired, as well as reports that are still open.
The Source document drop down box - The Source document drop down box allows you to list reports that have been created from a certain document such as ART, LCM, and PWO.
The Delayed drop down box - The Delayed drop down box allows one to select and list reports for which the due date is exceeded.
The Group by folder - The Group by folder allows you to construct a filter to pick out specific subsets of reports.
To group reports by a certain property, open the Group by folder and select one of the options in the dropdown-box to the left. Select a message type, and press ENTER. The selected message type is added in the QAR Menu header along with a paint brush to remove the filter, and a Filter button to apply the filter.You may create a second, and a third filter before applying it.
Complex searches - To do more complex searches, click the Add Filter icon. A complex filter of up to 8 fields can be created by constructing conditions.
Extracting basic data for statistical analysis and graphical presentations
In order to analyze data, or present data graphically, data from the QAR archive can be extracted to a CSV file:
Create a filter using the Add Filter button, unless you want to extract data from all QAR reports in the archive.
Press F12 to open the action menu and choose the option Send CSV-file to myself. A spreadsheet file is created and sent to the user's email.